
Data Documentation for CDC WONDER Mortality Data
This document outlines the process for acquiring drug overdose mortality data from the Centers for Disease Control and Prevention's (CDC) Wide-ranging Online Data for Epidemiologic Research (CDC WONDER) "Multiple Cause of Death" dataset. It details the approach of the Southern Regional Drug Data Research Centers (SR-DDRC, or just DDRC) to extracting, transforming, and loading (ETL) this data into Microsoft SQL Server, as well as the creation of the dataset’s data dictionary. This guide is intended for data analysts and researchers interested in replicating the SR-DDRC’s process or using the data acquired by the SR-DDRC.
1. Overview of CDC Wonder
The CDC WONDER system provides CDC data from the National Vital Statistics System (NVSS), managed by the National Center for Health Statistics (NCHS). CDC WONDER includes nationwide statistics that users can query to generate aggregated results based on specific stratifications.
1.1 CDC WONDER Mortality Data
Users can stratify mortality data by various factors, including time (e.g., year, month), location (e.g., state, county), and demographic variables (e.g., age range, sex, ethnicity, race). The system also allows filtering by cause of death using ICD-10 codes, enabling the generation of customized datasets based on specified search criteria.
CDC WONDER provides mortality data for all age groups through the following datasets:
- Underlying Cause of Death
- Multiple Cause of Death
- U.S.-Mexico Border Area Mortality
- Compressed Mortality
Additionally, separate datasets are available for fetal and infant mortality.
2. CDC WONDER's Current Final Multiple Cause of Death Datase
At the time of this document’s creation, there were two versions of the "Current Final Multiple Cause of Death" dataset: one covering 1999–2018 and another covering 2018–Present. This separation is due to changes in the reporting of race and other variables that began in 2018. Data for 2018–2020 is "bridged," with the bridging process concluding in 2020. Users can choose to query data from either the 1999–2018 period or the 2018–present period. More information on these changes can be found on CDC WONDER’s Multiple Cause of Death page.
2.1 Data Use Guidelines and Confidentiality Standards
When querying CDC WONDER, users must agree to the CDC’s terms and conditions. Upon acceptance, access to the CDC WONDER web form will be granted.
2.2 Understanding Mortality Causes and ICD-10
Mortality causes are defined using the International Classification of Diseases 10th Revision (ICD-10). However, WONDER includes specialized codes for deaths caused by terrorism, which are not part of the ICD-10 classification system. For more information on the ICD-10 CM system, please refer to the CDC’s ICD-10 CM page.
There are limitations to the WONDER data due to the revisions of the ICD. Older data categorized under previous ICD versions, such as ICD-9, may be inconsistent with newer data. Some causes of death listed in older ICD versions may no longer exist in the updated classifications. CDC WONDER, along with most of the US healthcare system, transitioned to ICD-10 codes in 2015.
3. DDRC Query Process
This section describes the CDC WONDER’s query system and the SR-DDRC process for querying the data in CDC WONDER.
3.1 Query System Functionality
The CDC WONDER query system provides users with an interface from which they can obtain tailored datasets. Users interact with the system through a webform where they record a set of choices on a range of options. Once submitted, it allows users to save their queries and generate a unique link for future reference. This feature allows users to revisit their queries, ensuring consistency in repeated analyses and facilitating collaboration through the sharing of queries.
3.2 DDRC Query Procedure
The SR-DDRC queried the "Current Final Multiple Cause of Death" dataset from CDC WONDER to acquire data on all drug overdose deaths and opioid-related overdose deaths in the 17 states within the SR-DDRC region, starting with 2010 and running to the latest available year. Due to the separation of the datasets into 2010–2020 data and 2018 and later data, the SR-DDRC extracted data from both versions and retained the overlapping period to ensure consistency. The system provides query options on seven domains: Organization; Location; Demographics; Day and Month; Weekday, Autopsy, and Place of Death; Underlying Cause of Death; and Multiple Cause of Death.
When querying the data, the SR-DDRC chose the following selections on the web form to create our base dataset. Additional variables were added to the base options as described below. Modifications are included as needed to develop additional datasets on an ad hoc basis.
The following selections were used for our base dataset queries:
-
Organize Table Layout
-
Within "Group Results by," the following variables were selected in this order:
- Under Header: Year and Month – “Year” was selected.
- Under Header: Location – “State” was selected.
-
Within "Group Results by," the following variables were selected in this order:
-
Select Location
- Among “Click a button to choose locations by US-Mexico Border Region, Border State Area, State, Census Region or HHS Region,” the default option of “States” was retained.
- Within the Browse box for states, the relevant 17 SR-DDRC states were selected.
- Within Urbanization, the default option of “All Categories” was retained.
-
Select Demographics
- All default options were retained. These were “Ten-Year Age Groups” for All Ages, “All” for Sex, “All Origins” for Hispanic Origin, “All Races” and Single Race 6, “All Races,” and “All Levels” for Education.
-
Select Year and Month
- Depending on the dataset version, either the years 2010–2018 or 2018 to the most recent year available were selected.
-
Select Weekday, Autopsy, and Place of Death
- All default options were retained. These were “All Weekdays” for Weekday, “All Values” for Autopsy, and “All Places” for Place of Death.
-
Select Underlying Causes of Death
- For “Click a button to select ICD codes by Chapters or by Groups,” the default option “UCD – ICD-10 Codes" was retained.
- Mirroring the approach used by the National Center for Health Statistics for identifying overdoses, within the Browse box for UCD – ICD-10 Codes, the following ICD–10 cause-of-death codes were selected: X40–X44, X60–X64, X85, & Y10–Y14
- To select ICD-10 codes, the section V01-Y89 was selected and the button "Open Fully" was clicked. Then, we scrolled down to each of these sections W00-X59, X60-X84, X85-Y09, and Y10-34, held the keyboard Control button (PC) or the command button (Mac), and selected the codes above until they all appeared in the “Currently selected:” box.
-
Select Multiple Cause of Death
- Mirroring the approach used by the National Center for Health Statistics for identifying overdoses, the following choices options were used. For “Click a button to select ICD codes by Chapters or by Groups,” the default option “MCD – ICD-10 Codes” was retained.
- To obtain All Drug Overdose-Related Mortality, the default selection “*All* (All Causes of Death)” was retained in the box for MCD – ICD-10 Codes.
-
To obtain Opioid-Related Overdose Mortality, the following ICD-10 Codes were selected from the box for MCD - ICD-10 Codes: T40.0, T40.1, T40.2, T40.3, T40.4, & T40.6
- To select ICD-10 codes, the section + S00-T98 was selected and “Open” was clicked. Then, the section T36-T50 was selected and “Open” was clicked. Finally, the section T40 was selected and “Open” was clicked. The codes listed above were moved into the top “Select Records” box titled “with any of these items:” by clicking the “Move Items Over <<<” button to the right of that box.
-
Other Options
-
The following checkboxes were selected:
- “Export Results”
- “Show Totals”
- “Show Zero Values”
- “Show Suppressed Values”
- The "Precision" box was set to 2 decimal points.
- For “Data Access Timeout,” the default option of 10 minutes was retained.
-
The following checkboxes were selected:
As indicated, this process was repeated for both datasets (i.e., 2010-2018 and 2018-Most recent year) and for both substance groupings (i.e., All Drug Overdose and Opioid-Related) to acquire the core of the dataset. To obtain the "Additional Variables" listed in the data dictionary, this process was repeated as needed. Acquiring these additional variables required specific modifications to the query on a case-by-case basis, including adjustments or changes to the selections. Each of these queries resulted in a separate export with distinct stratification. For additional guidance on obtaining these variables, please contact the SR-DDRC staff.
3.3 CDC WONDER Query Results File
The CDC WONDER query system exports results as text files when the "Export All Data Logs" option is selected. Each query produces a separate text file with the requested data stratification for the specified periods.
4. ETL Process
The Extract, Transform, Load (ETL) process is essential for preparing and integrating data from CDC WONDER into a relational database. This section outlines the steps used by the SR-DDRC. The following instructions assume a basic proficiency with the syntax and structure of the programming language(s) used.
4.1 CDC WONDER Query Results File
Each text file from CDC WONDER includes a summary of query variables, notes on data suppression, and additional documentation appended at the end of the file. While this supplementary information is useful for understanding the data context, it must be removed before importing the data into a relational database. Instructions on removing it are included below in section 4.2.1.
4.2 Data Transformation and Integration
This section outlines the systematic approach employed to transform and integrate raw data files into a structured format suitable for analysis within the SR-DDRC data repository. It details the steps taken to ensure data quality, including the removal of unnecessary elements, the standardization of data formats, and the loading of processed files into staging tables. The procedures described herein facilitate the accurate and efficient transfer of data from staging to production tables, thereby supporting subsequent analytical efforts.
4.2.1 File Inspection and Initial Modifications
The data transformation and integration process begins with inspecting the downloaded files from CDC WONDER using Notepad++. This inspection aims to identify the changes necessary to standardize the files for loading into the SR-DDRC data repository.
By opening the file in Notepad++ and enabling the "Show All Characters" option (see Image 1 below), several issues requiring attention become apparent:
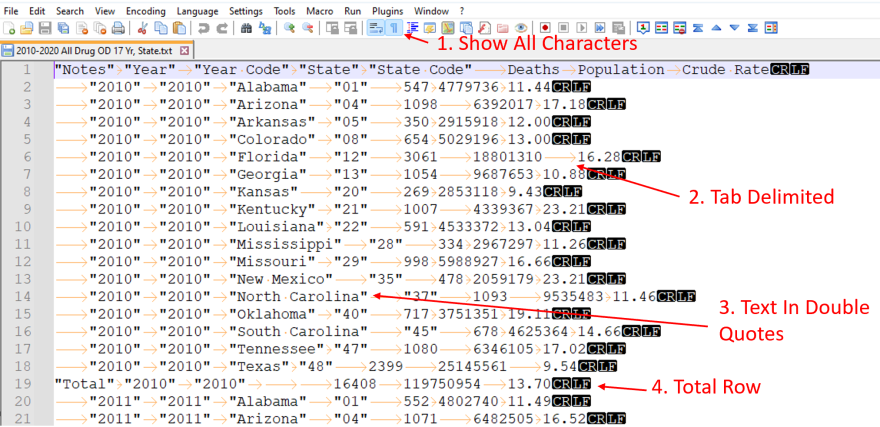
Image 1: Screenshot displaying the CDC WONDER Mortality data text file in Notepad++ with the "Show All Characters" option enabled, revealing the tab-delimited file structure, text values enclosed in double quotes, and total rows embedded within the data.
- Item 3 indicates that text fields are enclosed in double quotes. These quotes must be removed during the import process prior to inserting values into the database.
- Item 4 indicates the inclusion of a "Total” row. This row must be handled differently than the rest of the data rows, specifically by removing it before writing to the final production table.
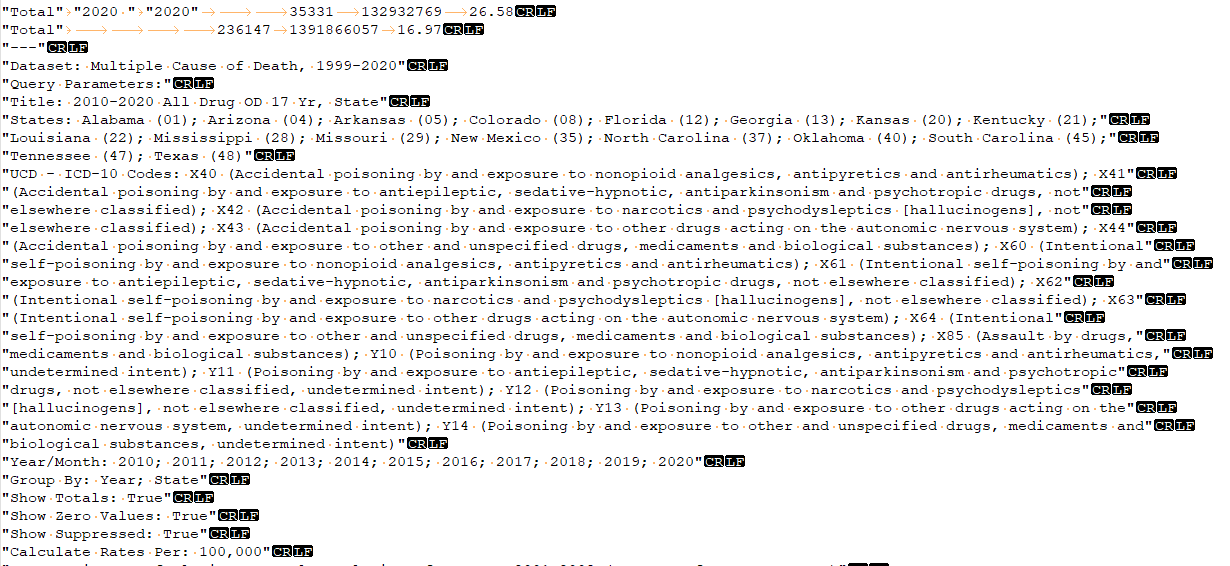
Image 2: Screenshot displaying the CDC WONDER Mortality data text file in Notepad++ showing the notes section positioned after the main dataset, containing supplementary information that must be excluded during the import process.
Each file includes a section with notes that contains supplementary information positioned after the main dataset and toward the end of the file. An example of this information is shown in Image 2. While this information provides valuable context regarding the file's content, it should not be loaded into the data tables and must be removed during the import process.
Lastly, the files are saved as .txt. The built-in data import process for SQL Server operates more efficiently with .csv files.
To address these issues, a simple PowerShell script was developed to perform the following tasks:
-
Retrieve all .txt files within the source folder structure recursively. This allows for the collection of files regardless of their location within the directory structure. For example:
-
Folder 1
-
Subfolder 1
- File 1
- File 2
-
Subfolder 2
- File 3
- File 4
-
Subfolder 1
- Note: All files (i.e., files 1, 2, 3, and 4) will be processed regardless of where they resided in the folder structure.
-
Folder 1
- Iterate through each .txt file
-
Read the content of each file and process each line:
- Replace the tab character with the pipe character
- Remove double quotes
- Eliminate the line containing “---” and every line thereafter, as this includes the notes which are not necessary for analysis. This is the third line down in the example provided in Image 2.
- Write the processed content to a new CSV file
After processing all downloaded files through this PowerShell script, the resulting files are now in the desired format, as seen in Image 3 below.
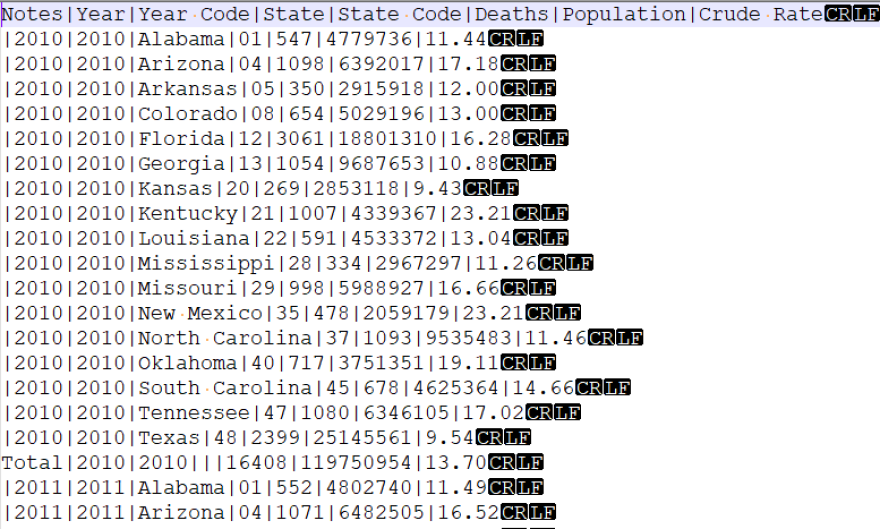
Image 3: Screenshot displaying the processed CDC WONDER Mortality data text file in Notepad++, with tab characters replaced by pipe characters, double quotes removed, and unnecessary notes excluded after running the PowerShell script.
With the completion of this process, the data is now packaged as a .csv file that can be utilized in SQL Server’s built-in BULK INSERT operation. The "Total" row remains present in the new .csv files and will be addressed in a subsequent data cleaning process.
4.2.2 Staging Table Setup and Data Loading
As detailed in our General Technical Overview document, our general process involves loading the entire raw file into a staging table before performing final cleaning and transformation prior to writing to the final production table.
The next step is to copy the processed file to a location accessible to the database server, either on the server itself or on a network share with read access. To facilitate this, a “Staging” table is created in the Staging database. In the staging table, all variables from the original files are added to their respective columns and are designated as “varchar” (varying character) for their SQL Server data type. This designation allows for the insertion of nearly any values into the table. For the basic stratification tables, the following variables are included:
- Notes
- Year
- YearCode
- State
- StateCode
- Deaths
- Population
- CrudeRate
Once the staging table is established, SQL Server’s BULK INSERT statement is employed to transfer the data from the .csv file to the staging database table. A sample of this command is:
BULK INSERT [YourDatabaseName].[dbo].[YourStagingTableName]
FROM <Full Path To Your File in Single Quotes>
WITH (
	FORMAT='CSV',
	FIRSTROW = 2,  --skip the header row
	FIELDTERMINATOR = '|', --the file is pipe delimited
	ROWTERMINATOR ='0x0a' –the default windows row terminator character in hex format
)
The final step in our process involves transferring data from the staging table to the production table. A production table must be created to store the finalized data, which can be achieved using the CREATE TABLE statement:
CREATE TABLE [YourDatabaseName].dbo].[YourTableName](
	[Notes] [varchar](1000) NULL,
	[Year] [varchar](10) NULL,
	[YearCode] [varchar](10) NULL,
	[State] [varchar](50) NULL,
	[StateCode] [varchar](10) NULL,
	[Deaths] [varchar](1000) NULL,
	[Population] [int] NULL,
	[CrudeRate] [varchar](100) NULL,
	[Source] [varchar](1000) NULL,
	[RecordCreatedDate] [datetime] NULL
) ON [PRIMARY]
GO
Fields are assigned different data types depending on the nature of the data. The Population field is created with an integer (Int) data type, while other fields retain the varchar type. The Population should always contain integer values. The Deaths field cannot be an integer due to instances where rows have a value such as ‘N/A.’
The fields Source and RecordCreatedDate are included to document the origin of each data row and the timestamp for when the data was inserted into the database. Creating the Source and Record variables can be useful if additional data imports occur in the future by providing a mechanism for versioning and tracking table updates. A primary key should also be established on the database table to ensure data integrity; the combination of the Year and State fields will provide sufficient uniqueness. A primary key is a constraint in the database structure that designates one or more fields to serve as the unique identifier for each row. Adding a primary key allows the database to efficiently reference, update, and relate records across tables while preventing duplicate entries.
Now that our production table is created, we proceed to transfer the data from the staging table to the production table using a script such as the following:
INSERT INTO [YourProductionDatabase].[dbo].[YourProductionTable]
	(Notes, Year, YearCode, State, StateCode, Deaths,
	Population, CrudeRate, Source, RecordCreatedDate)
SELECT TRIM([Notes]) as Notes
	,TRIM([Year]) as Year
	,TRIM([YearCode]) as YearCode
	,TRIM([State]) as State
	,TRIM([StateCode]) as StateCode
	,TRIM([Deaths]) as Deaths
	,TRIM([Population]) as Population
	,TRIM([CrudeRate]) as CrudeRate
	,'2021 All Drug OD 17 by Yr, State.csv' as Source
	,GETDATE() as Date
FROM [YourStagingDatabase].[dbo].[YourStagingTable]
WHERE [Notes] IS NULL
	AND [State] IS NOT NULL
GO
As indicated in the code above, subsequent modifications were implemented during the transfer of data tables from the respective staging tables to the production tables. Specifically, the Total row was excluded from the transfer using the above code, as we did not want this row to be included in the production dataset. This exclusion was achieved by evaluating the Notes and State fields, with the rows targeted for removal having NULL values in the Notes column and NOT NULL values in the State column.
Furthermore, each field was wrapped with the TRIM function to ensure that any leading or trailing spaces are removed from the values. We documented the filename from which the data originated as the Source and employed the SQL Server GETDATE() function to capture the current date and time, allowing us to track when each record was created.
Upon successful completion of this process, a final table containing CDC WONDER data is established in a relational database, which can then be utilized to connect to data visualization or other software applications.
5. SR-DDRC Data Dictionary
The SR-DDRC used information from CDC WONDER's Multiple Cause of Death "More Information" pages for the 1999-2020 and 2018-Most Recent datasets to create the SR-DDRC’s data dictionary for the exported files. Due to variations in the datasets, the dictionary includes separate sheets for 2010–2020 and 2018–Most Recent to clarify differences in variables, definitions, and possible values.
We recommend that users still review and reference documentation provided by the CDC WONDER for the most detailed and up-to-date information.
5.1 Base Stratification Variables
The following variables are included in all tables exported from CDC WONDER by the SR-DDRC. These base variables remain consistent across both dataset periods, 2010–2020 and 2018–Most Recent.
The base variables acquired from CDC WONDER include:
- Year
- State
- StateCode
- Deaths
- Population
- CrudeRate
5.2 Additional Stratification Variables
The following variables were acquired from unique exports from the 1999-2020 and 2018-Most Recent datasets. When exported, these additional variables were pulled with the base variables.
The additional variables acquired from CDC WONDER include:
- Age (Single)
- Age (5-year groups)
- Age (10-year groups)
- County
- County Code
- Gender (Sex)
- Hispanic Origin
- Race (Single/4) *
- Race (6) **
- Race (15) **
* Denotes that the variable is available for data from 2010 to 2020.
** Denotes that the variables are available for data from 2018 to Most Recent.
Please refer to the data dictionary for variable definitions and possible values.
If you have additional questions about this dataset, please contact us at info@srddrc.com